The agent gets a task (“plot these salaries as a horizontal bar chart, highest at the top, 7 by 5 inches”) and some CSV files. It writes matplotlib code and saves a PNG. My validator reads the task, the inputs, the agent’s trajectory and the PNG, and reports errors in four families:
| Family | Example |
|---|---|
execution_failure |
no figure, or the agent gave up |
wrong_data |
wrong values, wrong sort, rows dropped |
wrong_chart |
wrong chart type, title, axis scale, size or dpi |
hard_to_read |
clipped labels, legend over the data, overlapping text |
Each family is scored with the Matthews correlation (MCC) against human labels, and the four are averaged into a macro-MCC: 0 is chance, 1 is perfect. The course fixed the judge model. Everything around it was mine to design.
This post follows the score from −0.043 to 0.526. Twice along the way the number itself was wrong: once because my test labels were wrong, and once because a bug had hidden the agent’s code from the judge.
Worse than a coin flip
On the 110 seed runs, the validator the course provides scored a macro-MCC of −0.043. Its worst habit was answering one way and explaining the other:
YES: the agent crashed, ran out of turns or gave up.
“The agent successfully completed the task…”
All 23 of its execution_failure false alarms look like this. The question packs several conditions into one negative question, so the model can answer “yes” to one reading while its explanation follows another, and the validator only reads the first word. A “yes” also stopped the validator early, so it never checked the other three families.
Ask the model less
The first fix was to stop asking the model things a file can answer. Whether a figure exists and what dpi it was saved at are both in the PNG. So is a rough clipping test: if any non-background pixel touches the border, something is probably cut off.
The second was to stop asking broad questions. My rewrite splits the task into single requirements and asks about each one:
- 1Code: does the figure exist? Does the dpi match the request? Anything touching the border?
- 2Split the task into single requirements
- 3Judge each requirement against the figure: met, data error or chart error
- 4A short readability checklist on the figure
- 5Map everything to at most one error per family
The existence check alone took execution_failure from 0.07 to 1.0: all 12 real failures found, no false alarms. That one file check is the biggest step in the jump:
Asking one requirement at a time made the judge find data errors it used to miss. It also made it find errors that were not there:
Reading those 54 false alarms, I found the judge was often right about what it saw and wrong about where to file it. In 30 of them it spotted a real design problem, like a forbidden rainbow colormap, and called it a data error. That costs twice: a false wrong_data plus a missed wrong_chart. It had a few other habits too:
- Right problem, wrong family30 / 54
Saw the rainbow colormap or the wrong axis range and filed it as wrong data.
- "Cannot verify" counted as an error20 / 100
Of the 100 data and chart errors it reported, 20 had a reason saying the requirement could not be checked from the image, like dpi or size in inches. It once claimed a figure was saved at 120 dpi; the file said 100.
- Verdict contradicts the reason
A data error whose own reason confirmed the value was right.
- Invented evidence
A title "typo" quoting the same word twice. Swapped line colours on a chart whose legend matched.
"Matplotlib" vs "Matplotlib"
The invented evidence showed up on my own test tasks too. One task asked the agent to label the peak of y = x·e−x/3 and gave a sample label to show the format: “for example Peak: 2.50 at x=4.5”. Those sample numbers are not the real peak. The curve peaks at x = 3, where y = 3/e ≈ 1.10, and the agent labelled exactly that:
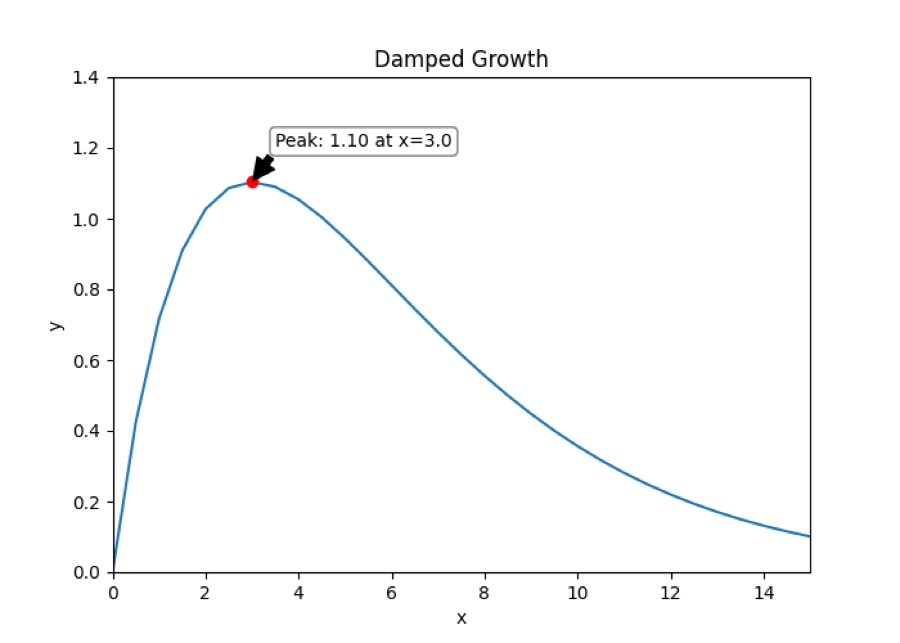
“The peak value shown is 1.10 at x=3.0, but the correct peak should be approximately 2.50 at x=3.0.”
The judge read the correct label off the chart, kept the agent’s x=3.0, and then claimed the value should be 2.50, the number from the format sample in the instructions.
The “cannot verify” habit had a direct fix, so a second round of changes added it: an explicit “cannot tell” answer that counts as no error, and a figure-size check in code. That round also took requirements from the task’s prose, not just its bullet list. I call the result Round 1. It scored 0.381 against the first rewrite’s 0.375, and it is the version every later experiment had to beat.
Readability got no fix like that, and it stayed the weakest family until the very last change in this post. Of the 39 readability errors in the seed set, the validator caught 3, all of them from the border-pixel test; the judge’s checklist added none.
Code has its own blind spot
For the course I also packaged five of my own tasks for Harbor, which needs a verifier per task written in plain code, with no model. Mine read the numbers the agent saved next to the plot. Then I tried to fool them with mutants: solutions I broke on purpose.
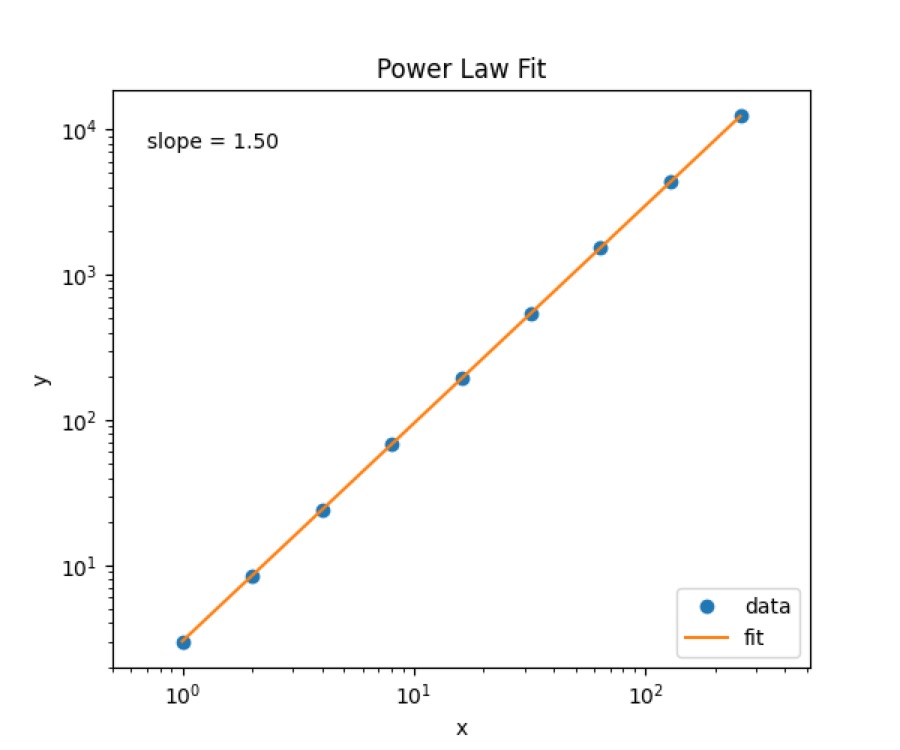
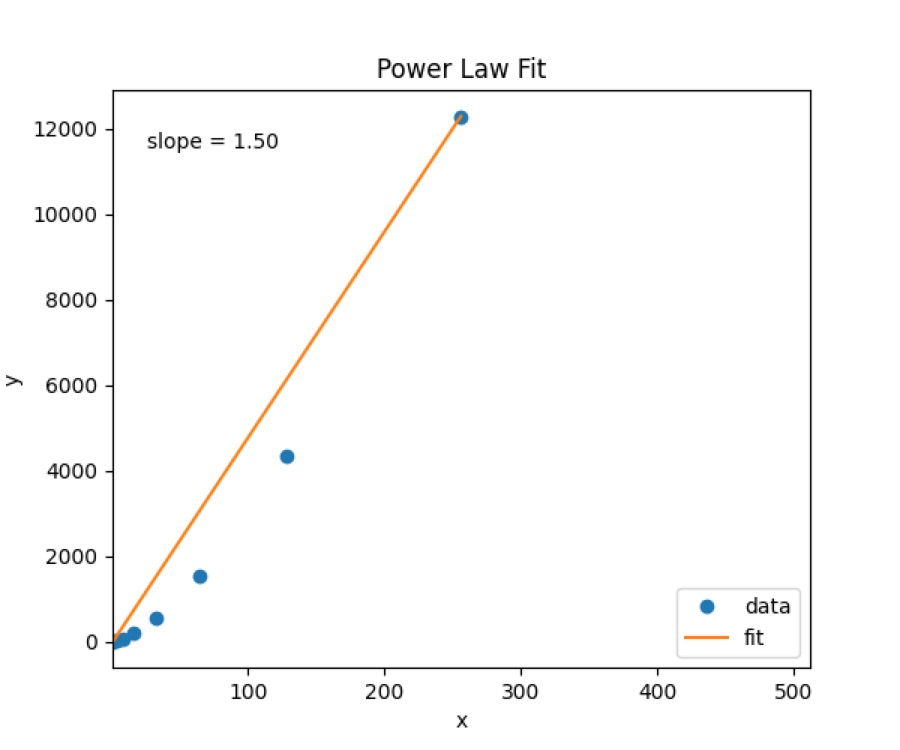
A mutant with the wrong exponent (y = 3x1.4 instead of 1.5) scored 0, so the number checks work. The linear-axes mutant has every number right and the wrong picture, and it scored a perfect 1.0. So did a mutant with 2-point text. Code can check what was computed, but checking what the reader sees takes something that looks at the image. So the vision judge stays, and I needed a way to tell whether a change to it helped.
A ruler that moves
I ran Round 1 twice, at temperature 0, on the same runs. It scored 0.381 and then 0.361. Nothing changed between the two, so that 0.02 is noise from the inference server itself. Which runs happen to be in the set adds more noise on top (sampling error), so I simulated how wide a 95% interval on one family’s MCC is at different sample sizes:
At ±0.20 on 100 runs, the seed set cannot tell most changes apart, so before running any experiments I set a rule. I split the seed runs into two halves, taking every other run, and a change counts only if it beats Round 1 on both halves by more than the rerun noise. Then I tried thirteen variants:
Rewordings, a guide to the families, asking for the reason before the verdict, voting over three samples and a filter for self-contradicting answers: none of them beat Round 1 on both halves, and most did worse on both. The filter fired on only 9 verdicts across 4 runs. The clearest result was dropping “cannot tell” (v02), which lost on both halves by more than the noise.
The two variants that got near the shaded corner did not reword anything. v10 asked about data and design in separate calls, and v12 also showed the data question the end of the agent’s trajectory. Only v12 cleared the bar.
I picked v12 after seeing its seed scores, though, so those scores flatter it. It needed a test on data it was not chosen on.
A bigger ruler, with its own bugs
My own fifteen test runs decide almost nothing, so I built a bigger labelled set. I took PandasPlotBench, rendered each task’s reference chart as the “correct” run, and made one mutant per family: rows dropped, a log axis where linear was asked, 3-point text, an opaque box over the data. The labels come from the mutation, so they are only right if the reference chart is.
The first sign that they were not came from my own border check. It flagged 111 runs as cut off that were labelled readable, and it was right: my renderer resized figures after layout, which clipped the labels on about 32 reference charts and the mutants made from them. After I fixed the renderer, the border check flagged only 2 runs labelled readable. Then two Claude reviewer agents with different briefs went through every reference chart against the readability rules:
That left 396 labelled runs: 110 correct, 96 wrong_data, 82 wrong_chart and 108 hard_to_read. The first thing it showed was what the judge cannot see:
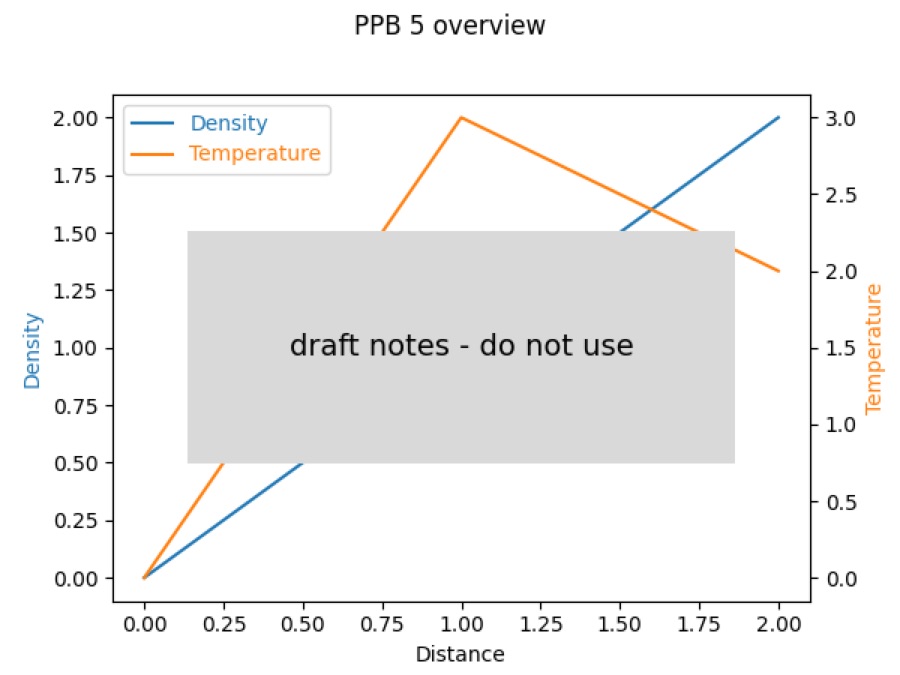
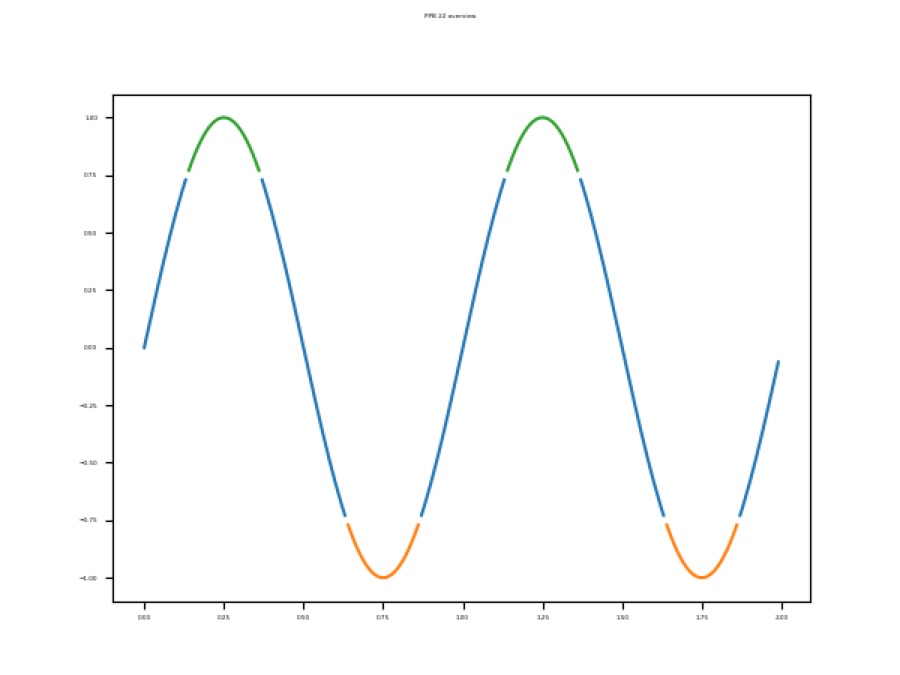
The judge spots a big grey box. Text shrunk to specks on an otherwise normal chart nearly always passed, and no prompt wording changed that. In a later round I also showed it each quarter of the image enlarged, and it still found only 3 of the 58. Measuring the text in code found them in the end (more on that below).
The set also exposed a real bug. My validator showed the judge only the first 3,000 characters of each input file. On one task that meant the judge saw a time axis that stopped at 10, and it called a correct plot of 0 to 100 wrong. The cap cut the inputs of 8 seed runs and 212 synthetic ones, so the bug was rare on seed and common here. The final version summarizes the whole file instead.
The synthetic set also gave separate calls (v10) a test on data they were not chosen on: wrong_chart went from 0.371 to 0.453, better on both halves. The set is no use for wrong_data, though. Some of its task descriptions ask for hover effects a PNG cannot show, and the cut inputs made correct plots look wrong, so I only read the other families from it.
What the judge sees
Until the last round, every change that survived was about what the judge is shown or asked, and the separate calls are the clearest case. Asked about data and design together, the judge filed design problems as data errors. Asked only about design, it cannot answer “data error”. On seed, v10 found 37 of the 71 chart errors where the single call found 26, with 2 false alarms either way.
The trajectory changes show the same thing, through a mistake of mine. v12 gave the data question the end of the agent’s trajectory, and reading its misses I found that the “trajectory” was the whole message list turned into one string, and the last 4,000 characters it showed were mostly token counts and timings. So v13 kept only the text of each message. It had the best half-A score of any variant, and I adopted it.
Then I had fresh Claude agents, which had not seen my reasoning, review the report against the code and the score files. One of them found the problem. In these trajectories the agent’s code is not in the message text; it sits in a separate tool-call field. v13 had removed the one thing it was meant to show, and its data judge flagged less because it saw less. v14 puts the plotting step back:
| End-to-end run | Seed | Half A / B | My 15 runs |
|---|---|---|---|
| v12: raw message string | 0.416 | 0.399 / 0.433 | 0.298 |
| v13: text only, code lost | 0.434 | 0.476 / 0.396 | 0.253 |
| v14: plotting step restored | 0.415 | 0.427 / 0.402 | 0.450 |
On seed, v14 ties v12. On my own tasks it is the only version that catches this one for the right reason:
“✓ Bars sorted by salary (highest at top)”
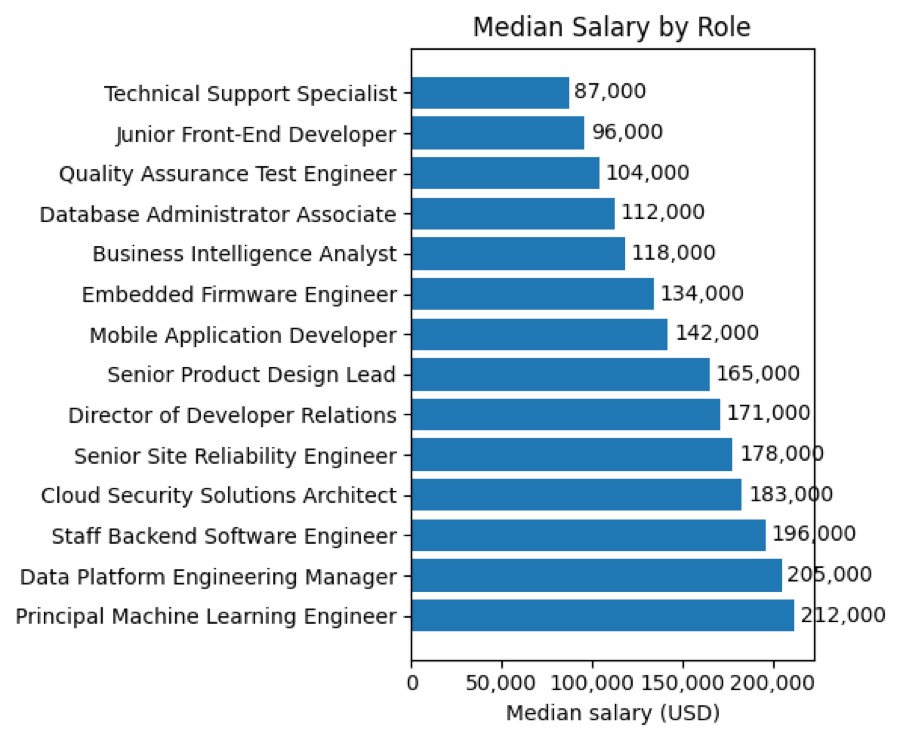
The agent sorted highest first, but matplotlib’s barh draws the first row at the bottom, so the chart came out upside down while the agent’s summary said it was right. v12 and v13 missed it. v14, the first version whose data call sees the plotting code, flagged it: “The bars are sorted in ascending order (lowest at top), but the requirement is to sort highest at top”. One run cannot prove that seeing the code is the reason. The final validator still uses v14’s data and chart calls.
Seeing the code is not enough on its own, though. In another of my tasks the agent’s code hid the bottom row’s tick labels with an inverted condition, if i >= 8: # Not bottom row, when panels 8 to 11 are the bottom row:
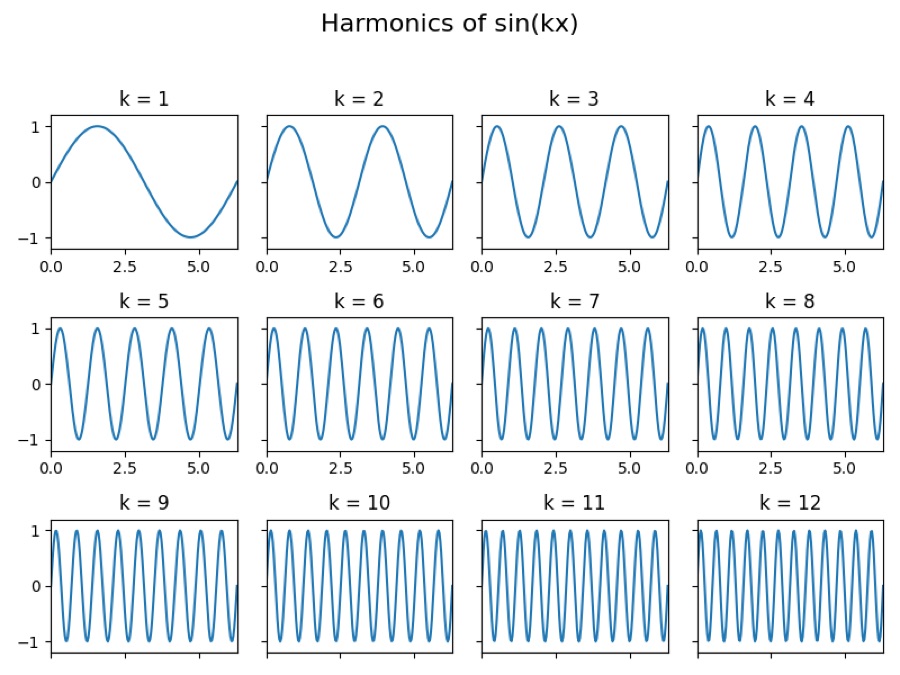
“Tick labels are visible on the left column and bottom row, and nothing is cut off or overlapping.”
In v14 only the data call sees the code, and tick labels are a design requirement, so they went to the design call, which sees only the image. In the round after v14 I showed the design call the code too. With the inverted condition right in its prompt, it still said the bottom-row labels were visible.
Measuring readability in code
After v14 I tried one more fix for each weak spot, under the same both-halves rule: showing the code to the design and readability calls, the enlarged quarters, and a filter that ignores data errors reported on design requirements. None passed. A plain rerun of the design call, with nothing changed, moved the two seed halves by +0.013 and −0.024, as much as most of the effects.
The filter did show something about the data judge. Some of the data errors it removed were on runs that really did have a data error, but in every such case the judge had flagged a design problem, like a colormap or a figure size, and not the real one. Those were lucky hits. So part of the data judge’s seed score comes from being right for the wrong reason, and stripping the wrong reasons can lower it.
The readability misses had a pattern: overlapping text, series you cannot tell apart, legends over the data. The judge passed them with or without extra evidence. Recent work points the same way. ChartJudgeBench finds that multimodal judges strongly over-predict “Accept” on charts, and VisEval checks layout overlap from the chart’s element boxes instead of asking a model. Two 2026 benchmarks, DV-World and SciVisAgentBench, also split the work: deterministic checks for what code can verify, and a model judge for the rest.
The validator already had what it needed to measure these instead. The agent’s plotting script is in its trajectory, and the input files are in the run. So the final version, v15, re-runs that script in a throwaway folder with a timeout and reads the live figure: where every piece of text sits, how big it is and what colour, each panel’s box, the legend entries, and how much data lies under a legend. Fixed rules then decide hard_to_read: text too small to read, overlapping or cut-off text, low contrast, a series drawn in the background colour, two legend entries that look the same, a legend or text box over the data, and overlapping panels. I set the thresholds before scoring. The measurements count only if the re-run reproduces the submitted image; otherwise the judge decides, as in v14.
Of the 108 seed and authored runs with a figure, 97 re-ran and matched the submitted image pixel for pixel. The rest need scipy or seaborn, which the validator’s environment lacks, or crash on the agent’s own bug.
The seed gain is far above the noise: swapping in only the measured hard_to_read moved the two halves by +0.143 and +0.118. On my own tasks it caught a legend that no judge version had:
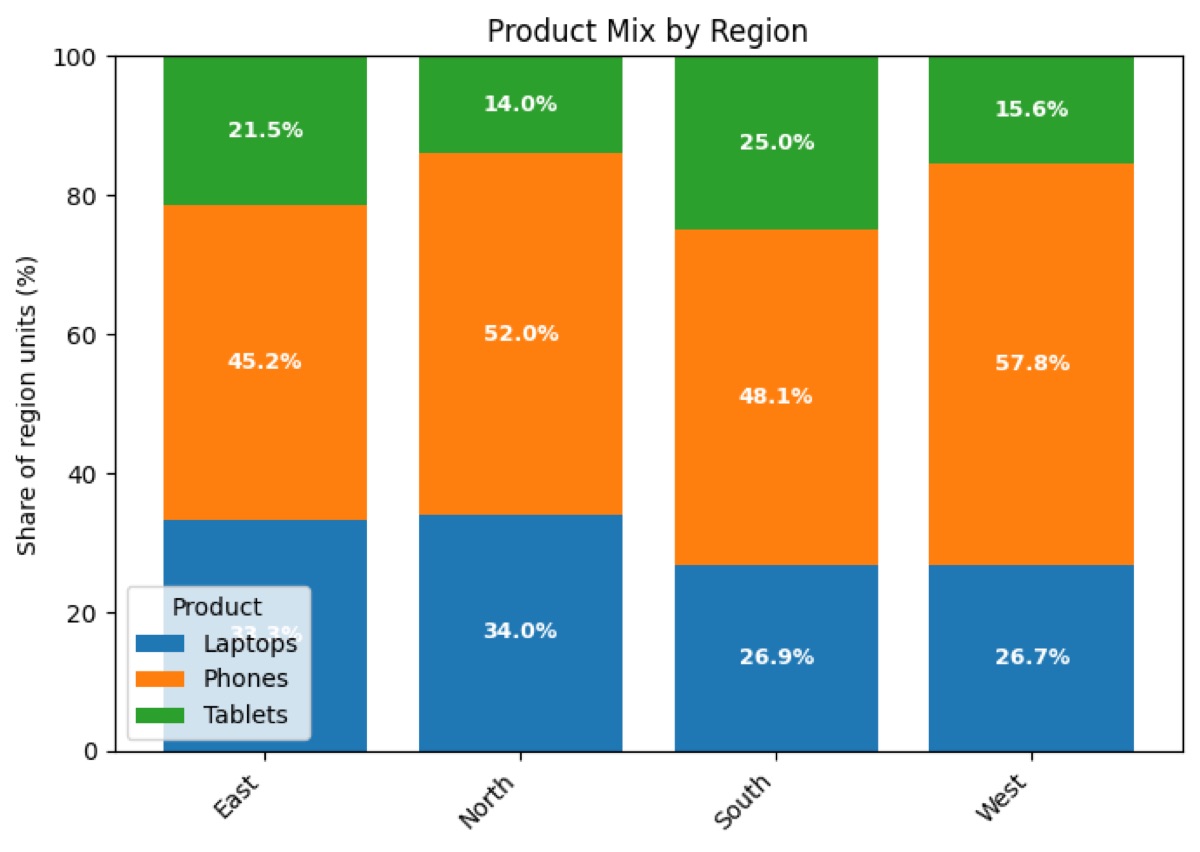
“text ‘33.3%’ overlaps text ‘Laptops’; text ‘33.3%’ has almost no contrast with its background; the legend covers plotted data”
It also flagged another agent’s run of the same task, whose legend covers about 5% of the bar area. I had labelled that run readable, so it counts as a false alarm, but it is a borderline case under the rules and the measurement itself is right.
v15 comes with two cautions. The validator now runs agent-written code on the grading machine. It gets a stripped environment and a 30-second timeout, but no network sandbox. And a test set full of seaborn or scipy charts would fall back to the judge more often.
In the same round I gave the data judge the re-run’s plotted values as text, instead of the code or next to it. It did no better. With the values instead of the code, seed wrong_data fell to 0.004; with both, it stayed within the noise, and on my own tasks it fell from 0.802 to 0.356. Keeping a data error only when the code-based and value-based calls agreed removed 2 of 43 false alarms. Changing the evidence left its false alarms in place, so my guess is they come from how it reads the requirements.
Where it ended up
On seed, the final validator beats Round 1 on both halves (0.528 and 0.523 against 0.352 and 0.409). On the synthetic set, which played no part in choosing the design, v14 is ahead on both halves and finds 72 of the 82 chart errors, against 53 before. The waterfall below picks up where the first one ended, at the first rewrite’s 0.375, so it covers every later round together:
Two changes carry it. Separate calls took wrong_chart from 0.113 in the first rewrite to 0.430 in v14’s run, and measuring the figure took hard_to_read from 0.148 to 0.672, the largest single gain in the project. wrong_data went the other way. The data call finds 17 of the 25 real errors (the first rewrite found 24) but still flags 43 of 73 clean runs, often for a wrong title or colormap that it files as data. Separate calls reduced the family confusion without removing it.
I am not reading the rise on my own tasks as evidence. v13 took the same 15 runs down to 0.253. Ten of them have a figure, so one verdict moves a family by 0.2 to 0.4. The seed and synthetic sets are the evidence I trust; the small set is for reading run by run.
What I would tell the next person
- Read the judge’s reasons, not just its verdicts. The baseline’s reasons contradicted its verdicts in all 23 of its false “agent failed” alarms, and my final judge still gets some data errors right for the wrong reason.
- Anything code can measure, measure. For me that started with the PNG file and ended with re-running the agent’s own plotting script.
- Rerun the same thing twice before you measure a change, and set the adoption rule before you see results.
- Check the winner on data it was not picked on, and check that data’s labels. My test set was wrong before my validator was.
- Print exactly what the judge receives. My best-looking variant had lost the agent’s code.
References
Papers I read while building and checking the validator. Some shaped a choice, like the “cannot tell” option. Others I found afterwards, and they backed up something already built, like the border check. Near the end I searched 2026 work specifically, and that search pointed me to measuring readability in code. Those papers are marked 2026 below.
Measure in code, ask the model the rest
- Meng et al., DV-World: Benchmarking Data Visualization Agents in Real-World Scenarios (2026). Checks numbers by aligning table values and leaves the visual side to a rubric-based model judge.
- Ai et al., SciVisAgentBench: A Benchmark for Evaluating Scientific Data Analysis and Visualization Agents (2026). Pairs an LLM judge with deterministic evaluators: image metrics, code checkers and rule-based verifiers.
- Chen et al., VisEval: A Benchmark for Data Visualization in the Era of Large Language Models (2024). Checks chart validity, legality and readability, measuring layout from the rendered chart instead of asking a vision model about it, which is what my final readability checks do.
- Yang et al., ChartMimic: Evaluating LMM’s Cross-Modal Reasoning Capability via Chart-to-Code Generation (2024). Scores charts from the code that drew them as well as from the picture.
One requirement per question
- Qin et al., InFoBench: Evaluating Instruction Following Ability in Large Language Models (2024). Splits an instruction into yes/no requirements.
- Cook et al., TICKing All the Boxes: Generated Checklists Improve LLM Evaluation and Generation (2024). Has a model write the checklist, then grades against it.
- Cho et al., Davidsonian Scene Graph: Improving Reliability in Fine-grained Evaluation for Text-to-Image Generation (2023). Atomic questions, and parent questions that gate their children.
Letting the judge say “cannot tell”
- Jung et al., Trust or Escalate: LLM Judges with Provable Guarantees for Human Agreement (2024). A judge that can abstain instead of guessing.
Don’t trust the agent’s word, or the judge’s
- Sanayei et al., Evidence-First Agentic Verification (2026). A verifier that checks each claim against its source before relying on it, including an agent’s own reports of success, like the barh self-check above.
- Jin and Chen, Are LLMs Reliable Code Reviewers? Systematic Overcorrection in Requirement Conformance Judgement (2026). LLMs often call correct code non-compliant with its requirements, and more detailed prompts make it worse. My data judge’s false alarms on clean runs look like the same habit.
Where vision judges are weak
- Wu et al., ChartJudgeBench: Evaluating LMM Judges for Chart-to-Code Generation (2026). Multimodal judges of charts lean strongly towards “Accept”, one reason I stopped asking mine about readability.
- Shi et al., Are VLMs Seeing or Just Saying? Uncovering the Illusion of Visual Re-examination (2026). When a model like Qwen3-VL says it is checking the image again, it mostly is not. A second look has to be a new question.
- Chen et al., MLLM-as-a-Judge: Assessing Multimodal LLM-as-a-Judge with Vision-Language Benchmark (2024). Vision-language judges come close to people when comparing two outputs and drift away when asked for scores.
- Rahmanzadehgervi et al., Vision language models are blind: Failing to translate detailed visual features into words (2024). Simple visual tasks that strong VLMs fail, close to my 3-point text and missing tick labels.
Noise, voting and small samples
- Kumar et al., All Verdicts are Not Equal: Rethinking LLM Judge Reliability (2026). Judge verdicts change across identical runs at temperature 0, as my 0.381 and 0.361 did.
- Kohli, Nine Judges, Two Effective Votes: Correlated Errors Undermine LLM Evaluation Panels (2026). Judges make the same mistakes on the same items, so nine of them are worth about two independent votes. My v11 voted over three samples from a single model, whose errors I would expect to overlap even more.
- Haldar and Hockenmaier, Rating Roulette: Self-Inconsistency in LLM-As-A-Judge Frameworks (2025). The same judge disagrees with itself across runs.
- Itaya et al., Asymptotic Properties of Matthews Correlation Coefficient (2024). Confidence intervals for one MCC and for the gap between two validators scored on the same runs, which is the comparison I kept making.
Checking the checker
- Delcourt et al., Breaking Models to Test the Judge: A Mutation Testing Approach for Semantic Evaluators of Domain Class Diagrams (2026). Injects known defects to test a judge, the same idea as my synthetic mutants, and finds it ranks judges much as manual review does.
- Shankar et al., Who Validates the Validators? Aligning LLM-Assisted Evaluation of LLM Outputs with Human Preferences (2024). Criteria drift: the rubric bends to fit the outputs you happened to see. One reason to test the winner on data it was not picked on.
Data and model
- Galimzyanov et al., Drawing Pandas: A Benchmark for LLMs in Generating Plotting Code (2024). PandasPlotBench, the source of my synthetic set (Apache-2.0).
- Bai et al., Qwen3-VL Technical Report (2025). The judge model family; I ran the 30B-A3B mixture-of-experts variant.